
The Data-Driven Westside: How Locals Win the Smart Way
- Hayley Stange
- Oct 28, 2025
- 4 min read


The New Reality of Real Estate
The real estate game is evolving at an unprecedented pace. Instinct and experience alone are no longer enough to make sound real estate decisions. Large companies are pouring enormous resources, both technological and human, into systems that model, assess, and predict market movements and opportunities. Ignoring data today means risking lost opportunities, if not outright losses.
The good news is that data has become far more accessible than ever before. Independent investors and smaller firms now have access to many of the same tools once reserved for major institutions. And a local resident often holds the greatest advantage of all. You live and work in your neighborhood. You know which streets are changing, which blocks are rising in value, where not to walk at night, and which friends are paying too much for rent. You are already reading your market intuitively. Using data is simply the next step toward turning that intuition into measurable insight.
Understanding the Numbers
Data is just a collection of numbers that represent real-world events. Every recorded home sale creates a data point. One price alone tells us little, but a collection of them tells a story. That story is often expressed through medians.
“Median” is a technical term for the number in the middle of a dataset, similar to an average but less affected by extreme outliers. The median sale price represents the midpoint of all sales. When it rises, it usually signals that neighborhood values are increasing. The same is true for median lease price. These are your foundation data points.
From there, we can build composite data, meaning metrics created from other data. For example, multiplying a lease price by twelve months gives gross annual income. Dividing the sale price by that income yields the gross rent multiplier (GRM), a quick way to gauge rental profitability. A higher GRM means lower profitability. You can reduce it by negotiating a stronger purchase price or finding ways to increase annual income.

Digging Deeper into Market Metrics
Other ratios also help. Price per square foot allows comparisons between properties of different sizes. If one house is 2,000 square feet and another is 1,300, dividing price by size gives a fair comparison. Most neighborhoods settle around a consistent cost per square foot.
Vacancy rates reveal how hot a rental market is, while after-repair value (ARV) estimates potential profit for flips. One of Los Angeles’s superpowers is its consistently low vacancy rate. Rentals rarely sit empty for long.
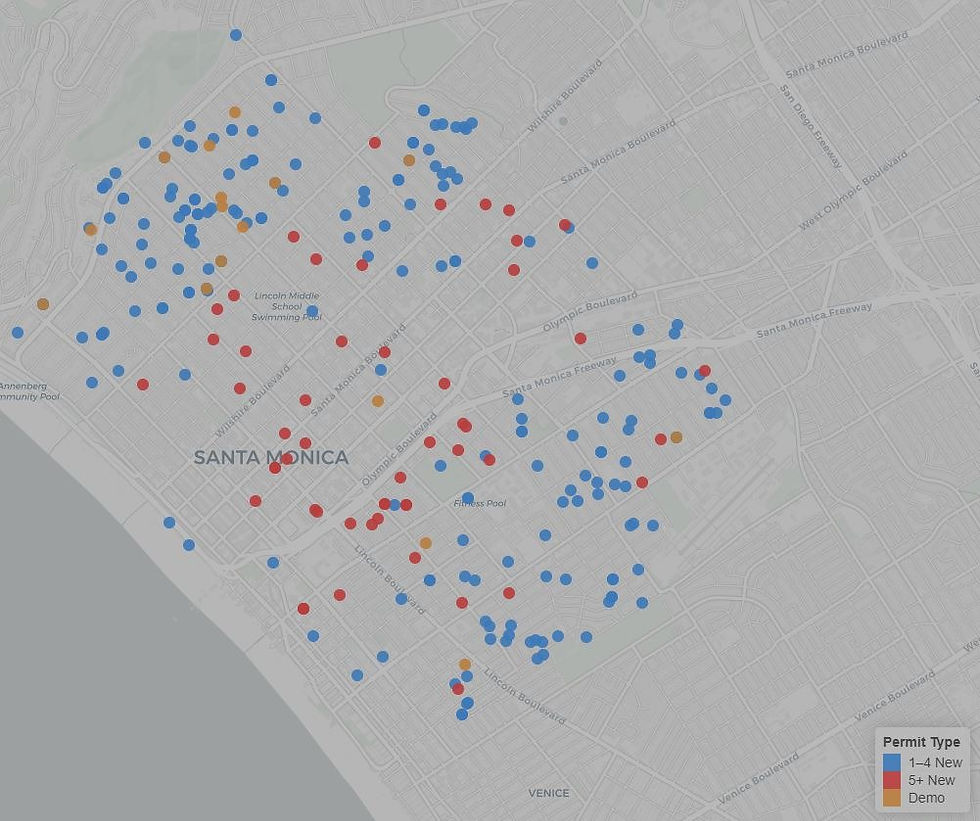
We can also learn from broader market signals. Rising median incomes suggest a wealthier or better-paid population, which can push rents and prices upward. Age data shows what kind of housing demand may be coming. Younger adults often favor smaller spaces, while families and older buyers need more room. Permit data reveals what kinds of projects are underway. A surge in new construction often reflects investor confidence and signals growth ahead.

Connecting Data to What You See Around You
Think about your own area. Do you see new buildings going up? Fresh paint on old storefronts? Cafés and restaurants opening where empty lots used to be? It might be noisy now, but this activity usually means progress. Modern, well-kept streets attract higher-income residents and stronger businesses.
You probably already have a sense of which streets are improving and which are lagging behind. Data lets you quantify that feeling.
Here is an example. You notice that several nearby streets are being renovated. Some houses look brand new while others are still run-down. You check the data and find that both median sale and lease prices are climbing. GRM is falling, which is good; it means lease prices are rising faster than sale prices. The median price per square foot in the area is around $500. Because you know there is a college nearby and steady rental demand, you decide to look for a multifamily property under $500 per square foot where light improvements could raise value and rent potential.
Balancing Instinct and Information
Neither data nor intuition alone is enough. Real estate is an expensive, high-stakes asset whether for investment or personal use. The smartest decisions come from balancing both: analyzing data while trusting lived experience.
In today’s market, data is cheap and abundant. Anyone, whether investor, developer, seller, or buyer, can make informed choices and reduce guesswork. Data does not replace the human side of real estate. It enhances it.
If you would like to see how data could help you reach your goals, whether that means buying your first home or planning your next investment, reach out. We will meet for coffee, look at the numbers, and design a strategy that fits your goals.


Comments